Data Design transforms data into usable and accessible information. A central discipline of Data-Driven Economy.
“Data is a precious thing and will last longer than the systems themselves.” – Tim Berners-Lee, inventor of World Wide Web, more famous as WWW.
As we know, collection, analysis and best use of data are become the main factor into decision-making processes of companies, institution and individuals. If we think about it, it is a constant and unstoppable generation of data, where “we are the product.”
Marco Delmastro and Antonio Nicita have highlighted in an Italian article Big data – Come stanno cambiando il nostro mondo that, again, reiterates the “implicit exchange that sees us unconscious protagonists”, if not excessively careless, “in the game of algorithms” (Sole24Ore, Big data – il prodotto siamo noi).
But, what is the topic in which new frontiers are realized and match the new trends of Data Design and Visual Communication, that on its own goes into Information Visualization and Visual Storytelling? A scenario made of accumulation and uncontrolled pervasiveness of data to be “subtracted from the background noise” and raised to information, through the best possible representation.
Data design: what is the value of data?
“You can have data without information, but you cannot have information without data.” – Daniel Keys Moran, programmer and an author of American fiction.
That is the real point. To obtain information, and therefore cognitive value, is mandatory provide raw material with structures, methods and relationships that allow readability on the one hand, and the possibility of self-fulfillment on the other.
As part of a hypothetical study, it doesn’t matter if a subject responds positively to a certain vaccine. The other situation occurs, if the positive outcome is given by a representative sample of individuals.
Make sense of the information
Indeed, it is difficult that a data explains itself on his own, without being placed in a context or without being compared with other data. The value of a number is into the information that it contains, but this one do not percepts itself in its explicit form. The information can be correctly received only by placing data into an organized system, in which the latter, putted in relation with other data, assumes relevance and meaning.
Data design works for this: to transform data into something useful and accessible. Data design considers data like an information, using structures and systems to organize row data and convert them into meaning contents.
Let’s go back to the question that we asked ourselves at the beginning of this paragraph: how much is data worth? A little bit, the value is generated at the moment in which, the data organized and classified, can to bring out information. Data is in fact the prerequisite for designing information, the material for giving shape and producing meaning.
Images as maps
“By visualizing information, we turn it into a landscape that you can explore with your eyes, a sort of information map. And when you’re lost in information, an information map is kind of useful.” – David McCandless, designer, creative director and founder of Information Is Beautiful.
McCandless takes us to the next step: the method to represent the information, a lot of organized and structured data. Using visual instruments and, why not, it is also very attractive and definitely has benefit.
So are the real needs of understanding and filtering how quickly evolution of technology is at our disposals, leaving us the free choice of passively undergoing or taking control? Need as concrete as common. Government, finance, marketing, history, service industries, education, sports, entities, private companies. And surely we only mentioned a small part of it.
Representation, culture, memory
Let’s take back the words of Tableau’s post: “Our eyes are drawn to colors and patterns. We can quickly identify red from blue, square from circle. Our culture is visual, including everything from art and advertisements to TV and movies. Data visualization is another form of visual art that grabs our interest and keeps our eyes on the message”.
How don’t agree. Our history, our memories are made by frames of images and representations, lived in the first person or evoked by stories. Without to be long about the various mechanisms of perception – where the human eye works according criteria of similarity, relation and systems – the sciences and arts of visualizations exploit the most primitive form of communication to process messages.
There’s a lot of criteria with which to transmit information through visual elements. From the most classic and historical ones, like graphics and maps, to the more modern ones where the interactivity and real-time play a key role.
Information Visualization or Visual Storytelling? The narrative element.
As sure that the visual communication has a fundamental relevance in our age, it remains to understand with which approach to take it. At this point, there are two driven goals. Depending on these ones and the type of message you intend to transmit, there are two possibilities.
The first one is that of Information Visualization. In this case, the information was structured and will be made available to the reader/user, who will be free to extrapolate his conclusions and observations.
Another possibility is that of Visual Storytelling. Here, visual communication is used and structured for create visual narratives. The intention is to transmit a precise message, for which the reader/user will be guided within a narrative.
The discriminating element between these two possible paths is the narrative element. In Visual Storytelling the information is contextualized and personalized, and full of meaning for the reader managing and creating their interest.
Some words about process and economy: Data Driven Economy and Data Design Thinking
The growing and various accessibility to this infinite amount of data has not only added value and importance to the visual sciences, but has even led to the birth of its own economy.
We are talking about Data-Driven Economy, an economy generated by a type of knowledge based on the ability to make the best use of the amount of information that circulates every day inside and outside each organization.
It is based on a new culture – that of data – grown from the permeability of technologies, where awareness and control are considered fundamental parameters for management. But history teaches us another thing: if there is a culture, if there is an economy, is probable that there is also a new way of thinking.
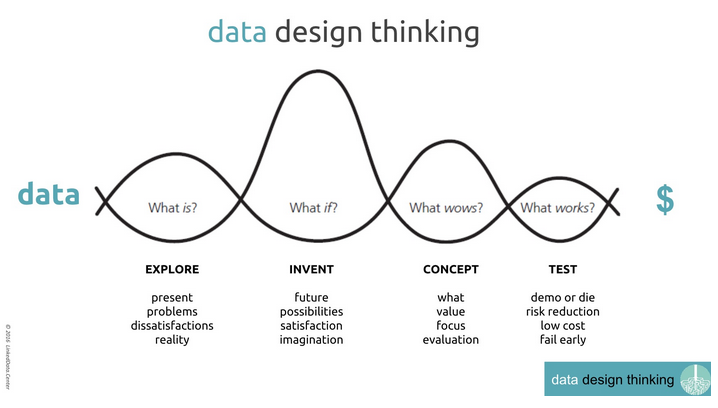
Data Design Thinking
This way it is called the decisional process based on data management. It’s a process aimed at extracting value from data and composed of four specific moments: explore, invent, concept and test. (source: linkeddata.center)